Thursday, April 12, 2012

Cognos Insight

To add on to what has been mentioned in the previous article, this new component from IBM allows users to pull in data from a number of sources and not just TM1 as I had wrongly assumed.

From a licensing perspective this requires Advanced Business Author role or above for BI and TM1 contributor role or above for TM1. The tool integrates with Cognos 10.1.1 and TM1 10.1.

Here's what else I could find on IBM site:

You have all the capabilities of the Insight Standard Edition plus:
• Import data from existing Cognos reports
• Share files using the Cognos Connection portal
• Publish and distribute content to the server for managed deployment
• Extend content created with Insight to other Cognos tools and interfaces like mobile and Web
• Use Insight as the interface to contribute to a managed planning process


Since this is a stand-alone desktop tool, I am curious as to how it fits architecturally with other Cognos components and how requests are executed. Since it supports in-memory analysis is this in-memory analysis handled on BI server or on the client machine? And if it uses a TM1 engine behind the scenes, how do requests flow when reports are used as sources?

If anyone has any inputs, questions, concerns as always please let us know.


Wednesday, April 11, 2012

All New IBM Cognos Insight

IBM recently released a new component IBM Cognos Insight bundled with TM1 10. This is not related to Business Insight and is a separate Dashboarding component. I am yet to read up and evaluate this so expect more on this from me in later articles. The demos look cool though.

The tool seems to be more inclined to supporting TM1 10 and has an in-memory analytic engine with write-back capabilities. Visually too this looks so much better than our Business Insight.

But as always with any new release there are bound to be disappointments so the wish list here too is huge.

More to follow.

Tuesday, April 3, 2012

Multi Tab Portlets cause CPS PAG Error

When using Multi Tabs portlet as the first tab in Cognos Connection, users might run into CPS-PAG-4801 error. The error is not consistent and refreshing the page renders the multi-tab portlet without error. THis does not happen when the multi tab portlet is placed after any of the other tabs.

This has been logged as a defect and is due to authentication information not being passed on to the portlet when used as the first tab.

The only work around is to use a HTML Viewer and have the URL for the Multi Tab portlet included in the HTML Viewer.

Monday, March 5, 2012

Optimized Master Detail relationships with DQM, not really

Here's an extract from IBM site on optimized master detail relationship using DQM (http://publib.boulder.ibm.com/infocenter/cbi/v10r1m0/index.jsp?topic=%2Fcom.ibm.swg.ba.cognos.dyn_query.10.1.0.1.doc%2Fc_master-detail.html):

Optimized master detail relationships in reports

Master detail relationships allow you to deliver information that would otherwise require two or more reports.

You specify a relationship between the query in the master data container and the query in the detail data container. For example, you can combine a master list with a detail chart. The list can contain product lines and the chart can show details for each product line.

With the dynamic query mode, master detail relationships are optimized. IBM® Cognos® pushes the master query as a separate edge to the detail query. Therefore, instead of sending one detail query to the data source for each master value, only one query is sent for HTML, PDF, and Microsoft Excel spreadsheet software output formats.
That is not the case though when you check the profile tree logs. Master detail relationships, still execute the old fashioned way with DQM. I had this confirmed by IBM as well that this is as per design.
I am posting this so developers don't get misleaded by the article. Wish IBM removes the misleading article.


Wednesday, February 8, 2012

Business Insight - Limitations

A lot has been said and written about Business Insight. While you will come across a lot of articles highlighting the good, jazzy and the positive features of Business Insight, I wanted to focus on some limitations in the use of Business Insight.

Business Insight being a new technology/component from IBM, it has a lot of bugs that need to be fixed before we can benefit from the use of Insight. Most of these bugs that I have come across have to do with drill ups/downs. I consider these to be really important issues to be addressed as the primary shift in datasources is from relational to dimensional. The issues have been listed out in the article:

Another big drawback that I find is with respect to prompts. Though Slider and Check-box List prompts are available, Insight lacks the availabilty of value prompts, date prompts. These need to be created inside of reports and users need to drag them into the Insight reports to make use of them. Value prompts when dragged into Insight are not jazzy enough to blend with the other components on the screen.

Non Auto-Submit Value prompts when dragged into Insight cause individual Apply/Cancel buttons to appear for each such prompt.

The available Slider and List Box prompt has another disadvantage. When these prompts are set inside Insight, users need to select a list of values that need to appear in the prompts. Though this makes sense when you think of Insight as an ad-hoc tool, how often do you come across users who are willing to spend a few minutes to create an ad-hoc dashboard. More often than not, the requirement is to have pre-authored dashboards and in such cases this limitation is huge. New values don't show up unless the user goes in and modifies the prompts each time.

Another disappointment is you cannot convert the whole dashboard into different formats. You can only convert individual widget into various formats. So much for being able to take a snapshot of your dashboard.

Even though Insight was meant to be an ad-hoc dashboard environment but gone are the days when dashboards were static. Users require ability to slice and dice their key metrics data. With the line between Dashboards and Reports are getting blurred at some places it would be great to have more prompting capability in Insight.

Insight is a CPU intensive tool. Heavy dashboards can take a while to render.

Having dished out about Insight limitations, I need to say, I really liked the slider feature. Wish we had such components available in RS. It would be great to have some of the jazzy looking Active Report Prompt components also available in RS.

Your thoughts on Insight?

Tuesday, January 31, 2012

Hide/Display Drill Through Links based on Levels

In a dimensional report, how do you hide/display drill through links based on the levels of a dimension when drills are enabled on the dimension? Layout calculations/Style Variables/Conditional Style conditions do not support MDX functions. So how do we identify the level of the dimension that you are at and apply conditions to the drill through links to hide or display them?

This is where JavaScript comes to our rescue. As always, JS should be used at the developer's discretion as they are not supported by IBM and also these get executed at the client side and hence should not be used in data intensive reports.

Solution:

Step 1: Create the base report and enable drills in the report.

Step 2: Create the drill through links in the crosstab for the Quantity measure.

Step 3: Insert another Quantity data item along side the Quantity measure without drill through links.

Step 4: Insert a singleton, pointing to the Crosstab Query and insert a calculated data item: Ordinal - ordinal(level(item([Product line],0))).

Step 5: Insert 2 HTML Items before and after the singleton.

             <div id='Lvl'>
             </div>

Step 6: Insert 2 HTML items before and after the Quantity measure in the crosstab that doesn't have the drill through link.

             <div id='NoLinks'>
             </div>
Step 7: Insert 2 HTML items before and after the Quantity measure in the crosstab that has the drill through link.

             <div id='Links'>
             </div>

Step 8: Insert a HTML item below the crosstab. Include the below JS:

<script>
var Lvl = document.getElementById('Lvl');
var LvlSpan = Lvl.getElementsByTagName('span')[0];
var LvlVal = LvlSpan.innerHTML;

if(LvlVal==4)
{
for(i=0;i < document.getElementsByTagName('div').length;i++)
{
if(document.getElementsByTagName('div')[i].id=='Links')
{
document.getElementsByTagName('div')[i].style.display = 'block';
}
if(document.getElementsByTagName('div')[i].id=='NoLinks')
{
document.getElementsByTagName('div')[i].style.display = 'none';
}
}
}
else
{

for(i=0;i < document.getElementsByTagName('div').length;i++)
{
if(document.getElementsByTagName('div')[i].id=='Links')
{
document.getElementsByTagName('div')[i].style.display = 'none';
}
if(document.getElementsByTagName('div')[i].id=='NoLinks')
{
document.getElementsByTagName('div')[i].style.display = 'block';
}
}

}
</script>


Note: These techniques use JavaScript against underlying report objects in a IBM Cognos 8 BI report. For this reason, there is no guarantee that reports created using these techniques will migrate or upgrade successfully to future versions without requiring modifications. Any such modifications are the responsibility of the report designer.

<report xmlns="http://developer.cognos.com/schemas/report/8.0/" useStyleVersion="10" expressionLocale="en-us">
    <modelPath>/content/folder[@name='Samples']/folder[@name='Models']/package[@name='GO Sales (analysis)']/model[@name='model']</modelPath>
   
    <queries>
     <query name="Query1">
      <source>
       <model/>
      </source>
      <selection><dataItemMeasure name="Quantity"><dmMember><MUN>[Sales (analysis)].[Sales].[Quantity]</MUN><itemCaption>Quantity</itemCaption></dmMember><dmDimension><DUN>[Sales (analysis)].[Sales]</DUN><itemCaption>Sales</itemCaption></dmDimension><XMLAttributes><XMLAttribute name="RS_dataType" value="1" output="no"/></XMLAttributes></dataItemMeasure><dataItemMeasure name="Unit cost"><dmMember><MUN>[Sales (analysis)].[Sales].[Unit cost]</MUN><itemCaption>Unit cost</itemCaption></dmMember><dmDimension><DUN>[Sales (analysis)].[Sales]</DUN><itemCaption>Sales</itemCaption></dmDimension><XMLAttributes><XMLAttribute name="RS_dataType" value="2" output="no"/></XMLAttributes></dataItemMeasure><dataItemMeasure name="Revenue"><dmMember><MUN>[Sales (analysis)].[Sales].[Revenue]</MUN><itemCaption>Revenue</itemCaption></dmMember><dmDimension><DUN>[Sales (analysis)].[Sales]</DUN><itemCaption>Sales</itemCaption></dmDimension><XMLAttributes><XMLAttribute name="RS_dataType" value="2" output="no"/></XMLAttributes></dataItemMeasure><dataItemLevelSet name="Product line"><dmLevel><LUN>[Sales (analysis)].[Products].[Products].[Product line]</LUN><itemCaption>Product line</itemCaption></dmLevel><dmDimension><DUN>[Sales (analysis)].[Products]</DUN><itemCaption>Products</itemCaption></dmDimension><dmHierarchy><HUN>[Sales (analysis)].[Products].[Products]</HUN><itemCaption>Products</itemCaption></dmHierarchy></dataItemLevelSet><dataItem name="Ordinal"><expression>ordinal(level(item([Product line],0)))</expression></dataItem></selection>
     </query>
    </queries>
    <layouts>
     <layout>
      <reportPages>
       <page name="Page1"><style><defaultStyles><defaultStyle refStyle="pg"/></defaultStyles></style>
        <pageBody><style><defaultStyles><defaultStyle refStyle="pb"/></defaultStyles></style>
         <contents>
          <singleton name="Singleton1" refQuery="Query1">
   <contents><HTMLItem>
   <dataSource>
    <staticValue>&lt;div id='Lvl'&gt;</staticValue>
   </dataSource>
  </HTMLItem><textItem><dataSource><dataItemValue refDataItem="Ordinal"/></dataSource></textItem><HTMLItem>
   <dataSource>
    <staticValue>&lt;/div&gt;</staticValue>
   </dataSource>
  </HTMLItem></contents>
  </singleton><crosstab refQuery="Query1" horizontalPagination="true" name="Crosstab1">
           <crosstabCorner><style><defaultStyles><defaultStyle refStyle="xm"/></defaultStyles></style><contents/></crosstabCorner>
          
          
           <noDataHandler>
            <contents>
             <block>
              <contents>
               <textItem>
                <dataSource>
                 <staticValue>No Data Available</staticValue>
                </dataSource>
                <style>
                 <CSS value="padding:10px 18px;"/>
                </style>
               </textItem>
              </contents>
             </block>
            </contents>
           </noDataHandler>
           <style>
            <defaultStyles>
             <defaultStyle refStyle="xt"/>
            </defaultStyles>
            <CSS value="border-collapse:collapse"/>
           </style>
          <crosstabColumns><crosstabNode><crosstabNodeMembers><crosstabNodeMember refDataItem="Quantity" edgeLocation="e1"><style><defaultStyles><defaultStyle refStyle="ml"/></defaultStyles></style><contents><textItem><dataSource><memberCaption/></dataSource></textItem></contents></crosstabNodeMember></crosstabNodeMembers></crosstabNode><crosstabNode><crosstabNodeMembers><crosstabNodeMember refDataItem="Unit cost" edgeLocation="e2"><style><defaultStyles><defaultStyle refStyle="ml"/></defaultStyles></style><contents><textItem><dataSource><memberCaption/></dataSource></textItem></contents></crosstabNodeMember></crosstabNodeMembers></crosstabNode><crosstabNode><crosstabNodeMembers><crosstabNodeMember refDataItem="Revenue" edgeLocation="e3"><style><defaultStyles><defaultStyle refStyle="ml"/></defaultStyles></style><contents><textItem><dataSource><memberCaption/></dataSource></textItem></contents></crosstabNodeMember></crosstabNodeMembers></crosstabNode></crosstabColumns><crosstabFactCell><contents><textItem><dataSource><cellValue/></dataSource></textItem></contents><style><defaultStyles><defaultStyle refStyle="mv"/></defaultStyles></style></crosstabFactCell><crosstabRows><crosstabNode><crosstabNodeMembers><crosstabNodeMember refDataItem="Product line" edgeLocation="e4"><style><defaultStyles><defaultStyle refStyle="ml"/></defaultStyles></style><contents><textItem><dataSource><memberCaption/></dataSource></textItem></contents></crosstabNodeMember></crosstabNodeMembers></crosstabNode></crosstabRows><crosstabIntersections><crosstabIntersection row="e4" column="e1"><contents><HTMLItem>
   <dataSource>
    <staticValue>&lt;div id='NoLinks'&gt;</staticValue>
   </dataSource>
  </HTMLItem><textItem><dataSource><dataItemValue refDataItem="Quantity"/></dataSource></textItem><HTMLItem>
   <dataSource>
    <staticValue>&lt;/div&gt;</staticValue>
   </dataSource>
  </HTMLItem><HTMLItem>
   <dataSource>
    <staticValue>&lt;div id='Links'&gt;</staticValue>
   </dataSource>
  </HTMLItem><textItem><dataSource><dataItemValue refDataItem="Quantity"/></dataSource><reportDrills><reportDrill name="Drill-Through Definition1"><drillLabel><dataSource><staticValue/></dataSource></drillLabel><drillTarget><reportPath path="CAMID(&quot;Zynga_AD:u:2a4aa6305669dc40b168f26119e56912&quot;)/folder[@name='My Folders']/folder[@name='PoC']/report[@name='Tgt']"><XMLAttributes><XMLAttribute name="ReportName" value="Tgt" output="no"/><XMLAttribute name="class" value="report" output="no"/></XMLAttributes></reportPath></drillTarget></reportDrill></reportDrills><style><defaultStyles><defaultStyle refStyle="hy"/></defaultStyles></style></textItem><HTMLItem>
   <dataSource>
    <staticValue>&lt;/div&gt;</staticValue>
   </dataSource>
  </HTMLItem></contents></crosstabIntersection></crosstabIntersections></crosstab>
         <HTMLItem>
   <dataSource>
    <staticValue>&lt;script&gt;
var Lvl = document.getElementById('Lvl');
var LvlSpan = Lvl.getElementsByTagName('span')[0];
var LvlVal = LvlSpan.innerHTML;
if(LvlVal==4)
{
for(i=0;i &lt; document.getElementsByTagName('div').length;i++)
{
if(document.getElementsByTagName('div')[i].id=='NoLinks')
{
document.getElementsByTagName('div')[i].style.display = 'block';
}
}
}
else
{
for(i=0;i &lt; document.getElementsByTagName('div').length;i++)
{
if(document.getElementsByTagName('div')[i].id=='NoLinks')
{
document.getElementsByTagName('div')[i].style.display = 'none';
}
}
}
&lt;/script&gt;</staticValue>
   </dataSource>
  </HTMLItem></contents>
        </pageBody>
        <pageHeader>
         <contents>
          <block><style><defaultStyles><defaultStyle refStyle="ta"/></defaultStyles></style>
           <contents>
            <textItem><style><defaultStyles><defaultStyle refStyle="tt"/></defaultStyles></style>
             <dataSource>
              <staticValue/>
             </dataSource>
            </textItem>
           </contents>
          </block>
         </contents>
         <style>
          <defaultStyles>
           <defaultStyle refStyle="ph"/>
          </defaultStyles>
          <CSS value="padding-bottom:10px"/>
         </style>
        </pageHeader>
        <pageFooter>
         <contents>
          <table>
           <tableRows>
            <tableRow>
             <tableCells>
              <tableCell>
               <contents>
                <date>
                 <style>
                  <dataFormat>
                   <dateFormat/>
                  </dataFormat>
                 </style>
                </date>
               </contents>
               <style>
                <CSS value="vertical-align:top;text-align:left;width:25%"/>
               </style>
              </tableCell>
              <tableCell>
               <contents>
                <pageNumber/>
               </contents>
               <style>
                <CSS value="vertical-align:top;text-align:center;width:50%"/>
               </style>
              </tableCell>
              <tableCell>
               <contents>
                <time>
                 <style>
                  <dataFormat>
                   <timeFormat/>
                  </dataFormat>
                 </style>
                </time>
               </contents>
               <style>
                <CSS value="vertical-align:top;text-align:right;width:25%"/>
               </style>
              </tableCell>
             </tableCells>
            </tableRow>
           </tableRows>
           <style>
            <defaultStyles>
             <defaultStyle refStyle="tb"/>
            </defaultStyles>
            <CSS value="border-collapse:collapse;width:100%"/>
           </style>
          </table>
         </contents>
         <style>
          <defaultStyles>
           <defaultStyle refStyle="pf"/>
          </defaultStyles>
          <CSS value="padding-top:10px"/>
         </style>
        </pageFooter>
       </page>
      </reportPages>
     </layout>
    </layouts>
   <XMLAttributes><XMLAttribute name="RS_CreateExtendedDataItems" value="true" output="no"/><XMLAttribute name="listSeparator" value="," output="no"/><XMLAttribute name="RS_modelModificationTime" value="2011-06-09T13:51:23.483Z" output="no"/></XMLAttributes><reportName>Src</reportName><drillBehavior drillUpDown="true" modelBasedDrillThru="true"/></report>

Friday, January 20, 2012

Business Insight Bugs 10.1.1

Some Business Insight bugs discovered in Cognos 10.1.1 version:

  • Data formats and formats like Background colors, Fonts, borders not maintained after drill up/down.
  • Drilling up on an object containing a single member brings back sibling members rather than parent members.
  • Nested Metrics in crosstab columns lost on Drill up/down.
  • Prompts not reflected on report objects after Drill up/down.
  • Layout calculations in crosstabs lost on drill up/down.

Friday, January 6, 2012

Drill Through - Passing ParamDisplayValue of Parameters

How do you pass ParameDisplayValue of a Parameter through a drill through link rather than a ParamValue? This is a common requirement when you are dealing with passing OLAP values to Relational reports.

To do the above, set the "Property to Pass" property to "Member Caption" for the parameter in the Drill Through properties.

Monday, December 19, 2011

Hiding Left-Most Crosstab Columns

How do you hide left-most columns in a crosstab without impacting the alignment of other objects on the crosstab?

You may ask, why would anyone want to hide columns in the first place when you have the "Properties" property? That's because for some reason on 10.1.1 this doesn't seem to be working under certain scenarios. May be because there are prompt macros in the data items I want to use for drill throughs even though I don't want them on the layout. I had even set them on all possible edges. Once I have this figured out with IBM, I will update on why the Properties property isn't working.

Latest update from IBM on why the "Properties" property is not working in a crosstab against a cube in 10.1.1 is possibly because of a defect.

So as a work-around, I had to pull in the columns and hide them.

Properties that you need to set to hide the columns:

Background Color : White

Foreground Color : White

Font : 0px

Size & Overflow : 0px

Border : 1 pt None Black

Padding : 0px 0px 0px 0px


The only down-side is that when exported to excel you will see 2 empty columns to the left of the crosstab object.


Friday, December 16, 2011

TM1 & BI Integration issues

One point to be kept in mind while integrating TM1 and BI 10.1.1 is that it is best to stay away from special characters in the member names/aliases.

Another huge point that IBM hasn't confirmed yet but something that I am suspecting is that when you have the same members rolling up to different parent members TM1 makes each of those members unique by concatenating the entire path to the member with "^" character in the MUN. And this character causes the drill up/down feature to be disabled on 10.1.1 (not observed on 10.1).

Special characters like "&" in the member aliases not just in the MUN cause the screen to freeze when drill through links are clicked.

Sunday, December 11, 2011

InScope Report Function

How do you display a measure with different data formats against different Series elements in a chart? This is where conditional style and InScope report function comes to the rescue.

Requirement: Display a chart with Revenue measured against Product Line members in the primary axis and against web Order Method against the secondary axis. Display Revenue with 3 decimal places against Product Lines and 2 decimal places against Web order method.

This requirement can be extended to display different data formats against different series members.

Solution:

Step 1: Create the chart with Revenue as the default measure, Product Line dragged into Primary Series and Web Order Method dragged into Secondary Series and Year dragged into Categories.

Step 2: Select Revenue and create an advanced conditional style with the expression as InScope(Web)

Set the format in the style properties for this condition.


Likewise create another advanced condition for Product Line.


Saturday, December 3, 2011

Cognos 10 Chart Properties

While I was on the subjects of Cognos 10, thought I will write about some properties of the Charts that are positioned differently between the older versions of Cognos and the newer ones as I don't want people to get frustrated like I did trying to find some properties with the newer version.

The Line Style and Marker properties are now positioned on the Palette dialog box which according to me isn't meaningful.


I had spent considerable time trying to find these properties out that had almost given up with the newer charts and had planned on using the legacy charts and opening a ticket with IBM. Hope this helps others in some way.

Cognos 10 Prompts - New Features

As has been pointed out by Ziegenbart in his comments, with Cognos 10, you needn't use any Javascript to modify the value prompt title line. Cognos 10 provides properties through which you can control the first 2 lines of the prompts.


User Contribution [Ziegenbart]:

I've been using the properties of the value prompt itself to either customize or remove the header text. Super simple and no need to use javascript with the disclaimer that there is no guarantee it will work or won't break. (I'm using Cognos 10 btw).

The default selection for the "Header Text" under "Prompt Text" for the value prompt is "Automatic".

Click on the ellipsis to the right of "Automatic" in the "Header Text" property. Change the selection to "Specified text" and leave the text field empty.

The first two lines of the Value Prompt are now removed.

You can also use this to customize what the first line says to meet business needs by entering some text (e.g. "Please make selection")

You can manipulate many of the presentation elements of a value prompt using the properties menu.

Monday, November 7, 2011

Drills and JavaScripts - Conflicts

Most times, we have javascript codes inserted into our reports. Some of these codes could be harmless ones like displaying obects in tabbed modes. But it is advisable to analyze the impact of such code from an entire report functionality perspective. Dimensional reports with drills enabled re-run the reports with the drilled in objects and re-running reports may not be the intended functionality when you have JS codes.

Simple example, let us consider a report with JS for tabs displaying a chart and a crosstab with the chart being the default object displayed. User selects the crosstab tab and then drills up a level. Result, report displays the chart object at the drilled up level (if chart and crosstab use the same query items) since re-running the report re-runs the JS code and displays the default chart object. The user, instead might be expecting to see the crosstab report at the drilled up level.

Monday, October 31, 2011

Cognos BI and TM1 Integration

Before people start wondering if I am working on TM1, the answer is no. But I am working on using TM1 as a data source and hope to pick up on TM1 in due course.

Here are a couple of points that I think people who are planning on using TM1 as a datasource should consider:

  • TM1 cubes require an explicilty declared Measure dimension for the cubes to get imported into Cognos.


  • The cubes need to have named levels enabled on them for the levels to show up in Cognos.


  • Description attribute needs to be named as Description for the rolevalue of memberDescription to work in Cognos.


  • Cube based aggregation functions do not work on cells in TM1 that have rules defined on them.


Another point that I am still banging my head about is with security. With transformer cubes we have the cloak feature but that doesn't seem to be the case with TM1. Example, if a user has access to Products 1,2,3 belonging to Product Line 1 but does not have access to Products 4,5,6 belonging to the same Product Line, with a transformer cube when the user accesses Product Line 1 he will see the total specific to Products that he has access to but with Transformer he will see the total value of all the products belonging to the product line rather than the products that he has access to which accroding to me is a huge disadvantage. Still trying to work through this. Hope someone out there can shed more light on this.
 

Sunday, October 2, 2011

Using Stored Procedures in Reports


Here's a simplified requirement that requires using stored procedures in reports to set values.

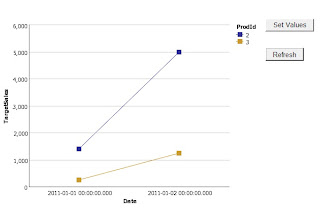
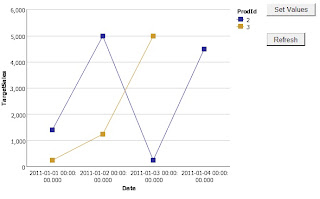
Requirement: Create a chart report to display Target Sales value. Provide users with option to set Target Sales Values that should get reflected when other users run the same report.

Solution:

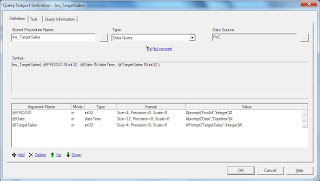
Step 1: Create a simple Stored Procedure that inserts ProdId, Date and Target Value into the target table. For our example and for simplicity I have created a SQL Server Stored Procedure. The Stored Procedure should return a dummy value so that we can create a Data Query Stored Procedure in FM.

Stored Proecures are of 2 types - Data Query and Data Modification. Data Query Stored procedures are visible for use in report studio while Data Modification Stored Procedures are not visible for use in report studio.


Step 2: Import the Stored Procedure in FM and set the prompt values.

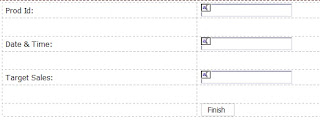
Step 3: Create a Prompted report to get the input values from the user. Insert text box prompts in the prompt page as shown below.


Step 4: In the report page drag the dummy return value and set the visible property to No. This will force the SP to get executed.Insert a text item to display a message to the users on sucessful execution of the Stored Procedure.


Step 5: Create the main report to display the chart object. Insert an HTML item to open the Prompted report:

HTML Item:
<script>
function SetValues()
{
window.open('<Prompted Report URL>','','width=400,height=400,menubar=no,toolbar=no');

}
</script>

<input type="button" value="Set Values" onclick="SetValues();">


Insert a RePrompt Button to refresh the report.


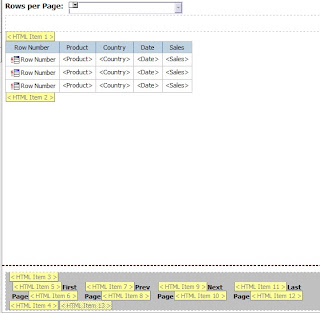
Dynamic Rows Per Page - Approach 2

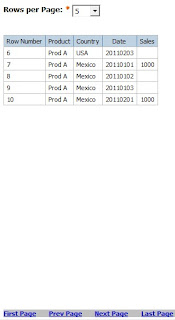
In continuation with the last article where we discussed achieving dynamic rows per page using Database functions, in this article we will discuss the same using JavaScripting where the processing happens on the client side. As discussed in the previous article report developers should weigh their options before opting for either of these approaches.

Approach 2: Client Side Processing

Solution:

Step 1: Create a Rows Per Page value prompt with static choices of 5,10, 15.. and a default selection of 5. Set the name of the prompt to Rows.

Step 2: Create a simple list report and set the Rows Per Page property to a value higher than the total number of rows returned

Step 3: Insert HTML items before and after the list report

    HTML Item 1: <div id="ListTbl">

    HTML Item 2: </div>

Step 4: Now to create a Pagination component, create a table in the Page Footer with 4 columns. Insert HTML Items before and after the table.

    HTML Item 3: <div id="Paginate">

    HTML Item 4: </div>

Step 5: Create First Page, Prev Page, Next Page, Last Page components in the 4 columns as shown below:


    HTML Item 5: <a href="#" onClick="paginate( 1);">

    HTML Item 7: <a href="#" onClick="paginate(currentPage - 1);">

    HTML Item 9: <a href="#" onClick="paginate(currentPage + 1);">

    HTML Item 11: <a href="#" onClick="paginate(lastPage);">

    HTML Item 6, HTML Item 8, HTML Item 10, HTML Item 12: </a>

Step 6: Insert an HTML Item and include the below JavaScript code:

<script>
    //get the List Table object
    var ListTbl = document.getElementById("ListTbl");

    var Tbl = ListTbl.getElementsByTagName('table')[0];

    //get the rows per page prompt value selected

    var fW = getFormWarpRequest();

    var rowsPerPg = fW._oLstChoicesRows.value;

    //get the total number of rows in the list

    var rows = Tbl.rows.length;

    var currentPage = 1;

    //get the last page value

    var lastPage = Math.ceil(rows/rowsPerPg);

    var rowStart;

    var rowStop;

    function paginate(currentPage)
    {
        window.currentPage = currentPage;
        rowStart = (currentPage * rowsPerPg) - rowsPerPg + 1;
        rowStop = (currentPage * rowsPerPg) + 1;
        if(currentPage==lastPage)
        rowStop = rows;

        for(i=1; i < rows ;i++)
        {
            //hide the display of all rows
            Tbl.rows(i).style.display='none';
        }

        for(i = rowStart ; i< rowStop ; i++)
        {
            //set only the required rows to display
            Tbl.rows(i).style.display='block';
        }

        var Paginate = document.getElementById("Paginate");
        var PaginateTbl = Paginate.getElementsByTagName('table')[0];

        if(currentPage==1)
        {
            //hide First Page and Prev Page components when on Page 1
            PaginateTbl.rows(0).cells(0).style.display = 'none';
            PaginateTbl.rows(0).cells(1).style.display='none';
        }
        else
        {
            PaginateTbl.rows(0).cells(0).style.display='block';
            PaginateTbl.rows(0).cells(1).style.display='block';
        }

        if(currentPage==lastPage)
        {
            //hide Last Page and Next Page components when on Last Page
            PaginateTbl.rows(0).cells(2).style.display='none';
            PaginateTbl.rows(0).cells(3).style.display='none';
        }
        else
        {
            PaginateTbl.rows(0).cells(2).style.display='block';
            PaginateTbl.rows(0).cells(3).style.display='block';
        }

    }

paginate(currentPage);

</script>


Note: This technique uses JavaScript against underlying report objects in an IBM Cognos 8 BI report. For this reason, there is no guarantee that reports created using this technique will migrate or upgrade successfully to future versions without requiring modifications. Any such modifications are the responsibility of the report designer.

Dynamic Rows Per Page - Approach 1

I have been working for the last couple of weeks on developing reports that can be integrated into websites and portals. Reports that need to be integrated into such sites need to be able to support a lot of interactive requirements. And one such requirement is the dynamic rows per page concept.

There are 2 ways to implement the same, one where the entire processing is pushed to the DB side and the other where the processing happens on the client side using JavaScript.

Such interactive requirements should only be supported when the number of rows retrieved is less else report rendering is going to be slow and in cases if the client side approach is used and the client environment is not powerful enough reports could result in hung screens. Some databases do not support running functions and when used these are executed on the Cognos server impacting performance. And with each click on the report re-executes the report query causing more queries to be fired against the DB.

Hence report developers should weigh their options before opting for either of these approaches.

Approach 1: DB only

Solution:

Step 1: Create a Rows Per Page value prompt with static choices of 5,10, 15.. and a default selection of 5. Set the name of the prompt to Rows.

Step 2: Create a Page text box prompt with default value of 1 indicating that the report should display Page 1 when run for the first time. Set the Visible property of the parameter to No.

Step 3: Create a Query say Query 1 with the required data items.

Step 4: Create the following Data Items:
RunningCount: running-count(1)

Page: ceil([RunningCount]/?RowsPerPage?)

Next Page: ?Page? + 1

Prev Page: ?Page? - 1

First Page: 1

Last Page: maximum([Page] for report)
Step 5: Create Query 2 with Query 1 as the referenced query. Drag all items from Query 1. Include a filter [Page] = ?Page?

Step 6: Create a simple list report based on Query 2

Step 7: Create the Paginate components of First Page, Prev Page, Next Page and Last Page text items in the Page Footer with drill through properties set on them.

Choose the "Pass Parameter Value" for the RowsPerPage drill through parameter and for the Page parameter set the below options for the various items.
First Page: Pass Data Item / [First Page]

Prev Page: Pass Data Item / [Prev Page]

Next Page: Pass Data Item / [Next Page]

Last Page: Pass Data Item / [Last Page]
Step 8: Create conditional styles to hide the First Page, Prev Page components when on Page 1.
Conditional Style 1: ParamValue('Page') = '1'
Step 9: Create conditional styles to hide the Next Page, Last Page components when on Last Page.
Conditional Style 2: string2double(ParamValue('Page')) = [Query2].[Last Page]


Wednesday, August 17, 2011

Optional Prompt Macros

A common misconception that I have noticed people have with respect to optional prompt macros is with regards to Preceding / Trailing text in a prompt macro.

An optional prompt macro always has a default value specified, so if no prompt value is selected the default value is applied in the query but this will not cause the preceding / trailing text in the macro to get applied. The preceding / trailing text get applied only if a prompt value is selected.

A simple example to demonstrate this:

We have ProdID and Sales displayed in a report.


The report has an optional prompt macro for ProdId defined as:

[Presentation Layer].[REVENUE_FACT].[PRODUCTID]= #prompt('Prod Id', 'Integer' ,1, '', '', 'and [Presentation Layer].[REVENUE_FACT].[SALES] > 5000' )#

Notice that the prompt macro has a default ProdID value of 1 and a trailing text that will add an additional filter of Sales > 5000.

When no value is selected for the ProdId prompt, the output displays data for Prod Id 1. Notice that the additional Sales filter doesn't get applied.


And here is the output when a ProdId selection of 1 is made. The additional Sales filter gets applied and displays the sum total of Sales for ProdId where Sales > 5000.


Wednesday, July 27, 2011

Importing Objects from FM into Other FM Models - Drawbacks

There are so many issues when trying to use this feature provided by Cognos. For a simple activity I tried importing 2 Data Source Query Subjects from Physical Layer of Model A into Test Layer of Model B. But the objects got imported into Physical Layer of Model A. To add on to my woes, it also imported a whole lot of other objects that had no dependency on the imported Query Subjects. These objects were Functions. So don't know if this has to do only with functions.

Another issue I found with this approach is that relationships between imported objects also get imported. And unlike Data Source based imports where users are prompted to choose to either create relationships or not, in case of model based imports this option is not provided requiring me to manually look up the imported objects and clean out those not required.

Copies of source model packages were also created which may be because the imported objects are part of the source model packages.

This is a powerful feature when you want to save time by re-using objects designed in other models but with all the issues listed out above, it seems to be a painful feature to use for the time being, until Cognos fixes these bugs. What can make this feature easier to use apart from fixing of the bugs would be options to select the kind of objects to import like 'relationships', 'calculations' etc. that may be dependent on the imported objects rather than having Cognos import all such dependent objects.