Monday, October 31, 2011

Cognos BI and TM1 Integration

Before people start wondering if I am working on TM1, the answer is no. But I am working on using TM1 as a data source and hope to pick up on TM1 in due course.

Here are a couple of points that I think people who are planning on using TM1 as a datasource should consider:

  • TM1 cubes require an explicilty declared Measure dimension for the cubes to get imported into Cognos.


  • The cubes need to have named levels enabled on them for the levels to show up in Cognos.


  • Description attribute needs to be named as Description for the rolevalue of memberDescription to work in Cognos.


  • Cube based aggregation functions do not work on cells in TM1 that have rules defined on them.


Another point that I am still banging my head about is with security. With transformer cubes we have the cloak feature but that doesn't seem to be the case with TM1. Example, if a user has access to Products 1,2,3 belonging to Product Line 1 but does not have access to Products 4,5,6 belonging to the same Product Line, with a transformer cube when the user accesses Product Line 1 he will see the total specific to Products that he has access to but with Transformer he will see the total value of all the products belonging to the product line rather than the products that he has access to which accroding to me is a huge disadvantage. Still trying to work through this. Hope someone out there can shed more light on this.
 

Sunday, October 2, 2011

Using Stored Procedures in Reports


Here's a simplified requirement that requires using stored procedures in reports to set values.

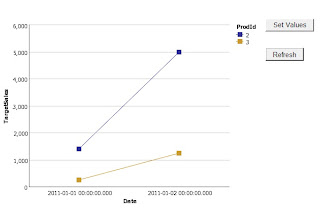
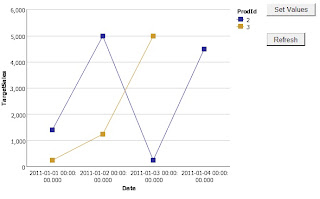
Requirement: Create a chart report to display Target Sales value. Provide users with option to set Target Sales Values that should get reflected when other users run the same report.

Solution:

Step 1: Create a simple Stored Procedure that inserts ProdId, Date and Target Value into the target table. For our example and for simplicity I have created a SQL Server Stored Procedure. The Stored Procedure should return a dummy value so that we can create a Data Query Stored Procedure in FM.

Stored Proecures are of 2 types - Data Query and Data Modification. Data Query Stored procedures are visible for use in report studio while Data Modification Stored Procedures are not visible for use in report studio.


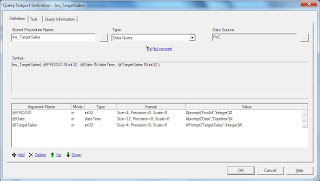
Step 2: Import the Stored Procedure in FM and set the prompt values.

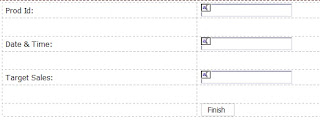
Step 3: Create a Prompted report to get the input values from the user. Insert text box prompts in the prompt page as shown below.


Step 4: In the report page drag the dummy return value and set the visible property to No. This will force the SP to get executed.Insert a text item to display a message to the users on sucessful execution of the Stored Procedure.


Step 5: Create the main report to display the chart object. Insert an HTML item to open the Prompted report:

HTML Item:
<script>
function SetValues()
{
window.open('<Prompted Report URL>','','width=400,height=400,menubar=no,toolbar=no');

}
</script>

<input type="button" value="Set Values" onclick="SetValues();">


Insert a RePrompt Button to refresh the report.


Dynamic Rows Per Page - Approach 2

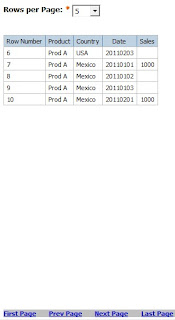
In continuation with the last article where we discussed achieving dynamic rows per page using Database functions, in this article we will discuss the same using JavaScripting where the processing happens on the client side. As discussed in the previous article report developers should weigh their options before opting for either of these approaches.

Approach 2: Client Side Processing

Solution:

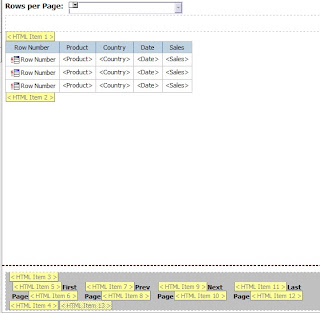
Step 1: Create a Rows Per Page value prompt with static choices of 5,10, 15.. and a default selection of 5. Set the name of the prompt to Rows.

Step 2: Create a simple list report and set the Rows Per Page property to a value higher than the total number of rows returned

Step 3: Insert HTML items before and after the list report

    HTML Item 1: <div id="ListTbl">

    HTML Item 2: </div>

Step 4: Now to create a Pagination component, create a table in the Page Footer with 4 columns. Insert HTML Items before and after the table.

    HTML Item 3: <div id="Paginate">

    HTML Item 4: </div>

Step 5: Create First Page, Prev Page, Next Page, Last Page components in the 4 columns as shown below:


    HTML Item 5: <a href="#" onClick="paginate( 1);">

    HTML Item 7: <a href="#" onClick="paginate(currentPage - 1);">

    HTML Item 9: <a href="#" onClick="paginate(currentPage + 1);">

    HTML Item 11: <a href="#" onClick="paginate(lastPage);">

    HTML Item 6, HTML Item 8, HTML Item 10, HTML Item 12: </a>

Step 6: Insert an HTML Item and include the below JavaScript code:

<script>
    //get the List Table object
    var ListTbl = document.getElementById("ListTbl");

    var Tbl = ListTbl.getElementsByTagName('table')[0];

    //get the rows per page prompt value selected

    var fW = getFormWarpRequest();

    var rowsPerPg = fW._oLstChoicesRows.value;

    //get the total number of rows in the list

    var rows = Tbl.rows.length;

    var currentPage = 1;

    //get the last page value

    var lastPage = Math.ceil(rows/rowsPerPg);

    var rowStart;

    var rowStop;

    function paginate(currentPage)
    {
        window.currentPage = currentPage;
        rowStart = (currentPage * rowsPerPg) - rowsPerPg + 1;
        rowStop = (currentPage * rowsPerPg) + 1;
        if(currentPage==lastPage)
        rowStop = rows;

        for(i=1; i < rows ;i++)
        {
            //hide the display of all rows
            Tbl.rows(i).style.display='none';
        }

        for(i = rowStart ; i< rowStop ; i++)
        {
            //set only the required rows to display
            Tbl.rows(i).style.display='block';
        }

        var Paginate = document.getElementById("Paginate");
        var PaginateTbl = Paginate.getElementsByTagName('table')[0];

        if(currentPage==1)
        {
            //hide First Page and Prev Page components when on Page 1
            PaginateTbl.rows(0).cells(0).style.display = 'none';
            PaginateTbl.rows(0).cells(1).style.display='none';
        }
        else
        {
            PaginateTbl.rows(0).cells(0).style.display='block';
            PaginateTbl.rows(0).cells(1).style.display='block';
        }

        if(currentPage==lastPage)
        {
            //hide Last Page and Next Page components when on Last Page
            PaginateTbl.rows(0).cells(2).style.display='none';
            PaginateTbl.rows(0).cells(3).style.display='none';
        }
        else
        {
            PaginateTbl.rows(0).cells(2).style.display='block';
            PaginateTbl.rows(0).cells(3).style.display='block';
        }

    }

paginate(currentPage);

</script>


Note: This technique uses JavaScript against underlying report objects in an IBM Cognos 8 BI report. For this reason, there is no guarantee that reports created using this technique will migrate or upgrade successfully to future versions without requiring modifications. Any such modifications are the responsibility of the report designer.

Dynamic Rows Per Page - Approach 1

I have been working for the last couple of weeks on developing reports that can be integrated into websites and portals. Reports that need to be integrated into such sites need to be able to support a lot of interactive requirements. And one such requirement is the dynamic rows per page concept.

There are 2 ways to implement the same, one where the entire processing is pushed to the DB side and the other where the processing happens on the client side using JavaScript.

Such interactive requirements should only be supported when the number of rows retrieved is less else report rendering is going to be slow and in cases if the client side approach is used and the client environment is not powerful enough reports could result in hung screens. Some databases do not support running functions and when used these are executed on the Cognos server impacting performance. And with each click on the report re-executes the report query causing more queries to be fired against the DB.

Hence report developers should weigh their options before opting for either of these approaches.

Approach 1: DB only

Solution:

Step 1: Create a Rows Per Page value prompt with static choices of 5,10, 15.. and a default selection of 5. Set the name of the prompt to Rows.

Step 2: Create a Page text box prompt with default value of 1 indicating that the report should display Page 1 when run for the first time. Set the Visible property of the parameter to No.

Step 3: Create a Query say Query 1 with the required data items.

Step 4: Create the following Data Items:
RunningCount: running-count(1)

Page: ceil([RunningCount]/?RowsPerPage?)

Next Page: ?Page? + 1

Prev Page: ?Page? - 1

First Page: 1

Last Page: maximum([Page] for report)
Step 5: Create Query 2 with Query 1 as the referenced query. Drag all items from Query 1. Include a filter [Page] = ?Page?

Step 6: Create a simple list report based on Query 2

Step 7: Create the Paginate components of First Page, Prev Page, Next Page and Last Page text items in the Page Footer with drill through properties set on them.

Choose the "Pass Parameter Value" for the RowsPerPage drill through parameter and for the Page parameter set the below options for the various items.
First Page: Pass Data Item / [First Page]

Prev Page: Pass Data Item / [Prev Page]

Next Page: Pass Data Item / [Next Page]

Last Page: Pass Data Item / [Last Page]
Step 8: Create conditional styles to hide the First Page, Prev Page components when on Page 1.
Conditional Style 1: ParamValue('Page') = '1'
Step 9: Create conditional styles to hide the Next Page, Last Page components when on Last Page.
Conditional Style 2: string2double(ParamValue('Page')) = [Query2].[Last Page]