Monday, December 19, 2011

Hiding Left-Most Crosstab Columns

How do you hide left-most columns in a crosstab without impacting the alignment of other objects on the crosstab?

You may ask, why would anyone want to hide columns in the first place when you have the "Properties" property? That's because for some reason on 10.1.1 this doesn't seem to be working under certain scenarios. May be because there are prompt macros in the data items I want to use for drill throughs even though I don't want them on the layout. I had even set them on all possible edges. Once I have this figured out with IBM, I will update on why the Properties property isn't working.

Latest update from IBM on why the "Properties" property is not working in a crosstab against a cube in 10.1.1 is possibly because of a defect.

So as a work-around, I had to pull in the columns and hide them.

Properties that you need to set to hide the columns:

Background Color : White

Foreground Color : White

Font : 0px

Size & Overflow : 0px

Border : 1 pt None Black

Padding : 0px 0px 0px 0px


The only down-side is that when exported to excel you will see 2 empty columns to the left of the crosstab object.


Friday, December 16, 2011

TM1 & BI Integration issues

One point to be kept in mind while integrating TM1 and BI 10.1.1 is that it is best to stay away from special characters in the member names/aliases.

Another huge point that IBM hasn't confirmed yet but something that I am suspecting is that when you have the same members rolling up to different parent members TM1 makes each of those members unique by concatenating the entire path to the member with "^" character in the MUN. And this character causes the drill up/down feature to be disabled on 10.1.1 (not observed on 10.1).

Special characters like "&" in the member aliases not just in the MUN cause the screen to freeze when drill through links are clicked.

Sunday, December 11, 2011

InScope Report Function

How do you display a measure with different data formats against different Series elements in a chart? This is where conditional style and InScope report function comes to the rescue.

Requirement: Display a chart with Revenue measured against Product Line members in the primary axis and against web Order Method against the secondary axis. Display Revenue with 3 decimal places against Product Lines and 2 decimal places against Web order method.

This requirement can be extended to display different data formats against different series members.

Solution:

Step 1: Create the chart with Revenue as the default measure, Product Line dragged into Primary Series and Web Order Method dragged into Secondary Series and Year dragged into Categories.

Step 2: Select Revenue and create an advanced conditional style with the expression as InScope(Web)

Set the format in the style properties for this condition.


Likewise create another advanced condition for Product Line.


Saturday, December 3, 2011

Cognos 10 Chart Properties

While I was on the subjects of Cognos 10, thought I will write about some properties of the Charts that are positioned differently between the older versions of Cognos and the newer ones as I don't want people to get frustrated like I did trying to find some properties with the newer version.

The Line Style and Marker properties are now positioned on the Palette dialog box which according to me isn't meaningful.


I had spent considerable time trying to find these properties out that had almost given up with the newer charts and had planned on using the legacy charts and opening a ticket with IBM. Hope this helps others in some way.

Cognos 10 Prompts - New Features

As has been pointed out by Ziegenbart in his comments, with Cognos 10, you needn't use any Javascript to modify the value prompt title line. Cognos 10 provides properties through which you can control the first 2 lines of the prompts.


User Contribution [Ziegenbart]:

I've been using the properties of the value prompt itself to either customize or remove the header text. Super simple and no need to use javascript with the disclaimer that there is no guarantee it will work or won't break. (I'm using Cognos 10 btw).

The default selection for the "Header Text" under "Prompt Text" for the value prompt is "Automatic".

Click on the ellipsis to the right of "Automatic" in the "Header Text" property. Change the selection to "Specified text" and leave the text field empty.

The first two lines of the Value Prompt are now removed.

You can also use this to customize what the first line says to meet business needs by entering some text (e.g. "Please make selection")

You can manipulate many of the presentation elements of a value prompt using the properties menu.

Monday, November 7, 2011

Drills and JavaScripts - Conflicts

Most times, we have javascript codes inserted into our reports. Some of these codes could be harmless ones like displaying obects in tabbed modes. But it is advisable to analyze the impact of such code from an entire report functionality perspective. Dimensional reports with drills enabled re-run the reports with the drilled in objects and re-running reports may not be the intended functionality when you have JS codes.

Simple example, let us consider a report with JS for tabs displaying a chart and a crosstab with the chart being the default object displayed. User selects the crosstab tab and then drills up a level. Result, report displays the chart object at the drilled up level (if chart and crosstab use the same query items) since re-running the report re-runs the JS code and displays the default chart object. The user, instead might be expecting to see the crosstab report at the drilled up level.

Monday, October 31, 2011

Cognos BI and TM1 Integration

Before people start wondering if I am working on TM1, the answer is no. But I am working on using TM1 as a data source and hope to pick up on TM1 in due course.

Here are a couple of points that I think people who are planning on using TM1 as a datasource should consider:

  • TM1 cubes require an explicilty declared Measure dimension for the cubes to get imported into Cognos.


  • The cubes need to have named levels enabled on them for the levels to show up in Cognos.


  • Description attribute needs to be named as Description for the rolevalue of memberDescription to work in Cognos.


  • Cube based aggregation functions do not work on cells in TM1 that have rules defined on them.


Another point that I am still banging my head about is with security. With transformer cubes we have the cloak feature but that doesn't seem to be the case with TM1. Example, if a user has access to Products 1,2,3 belonging to Product Line 1 but does not have access to Products 4,5,6 belonging to the same Product Line, with a transformer cube when the user accesses Product Line 1 he will see the total specific to Products that he has access to but with Transformer he will see the total value of all the products belonging to the product line rather than the products that he has access to which accroding to me is a huge disadvantage. Still trying to work through this. Hope someone out there can shed more light on this.
 

Sunday, October 2, 2011

Using Stored Procedures in Reports


Here's a simplified requirement that requires using stored procedures in reports to set values.

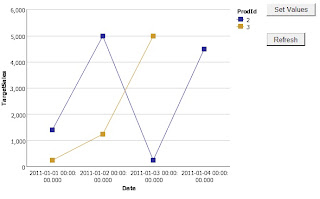
Requirement: Create a chart report to display Target Sales value. Provide users with option to set Target Sales Values that should get reflected when other users run the same report.

Solution:

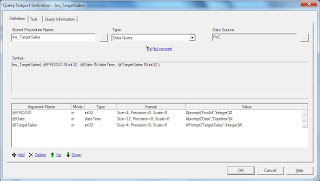
Step 1: Create a simple Stored Procedure that inserts ProdId, Date and Target Value into the target table. For our example and for simplicity I have created a SQL Server Stored Procedure. The Stored Procedure should return a dummy value so that we can create a Data Query Stored Procedure in FM.

Stored Proecures are of 2 types - Data Query and Data Modification. Data Query Stored procedures are visible for use in report studio while Data Modification Stored Procedures are not visible for use in report studio.


Step 2: Import the Stored Procedure in FM and set the prompt values.

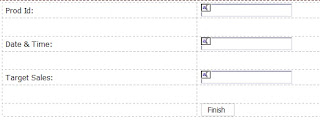
Step 3: Create a Prompted report to get the input values from the user. Insert text box prompts in the prompt page as shown below.


Step 4: In the report page drag the dummy return value and set the visible property to No. This will force the SP to get executed.Insert a text item to display a message to the users on sucessful execution of the Stored Procedure.


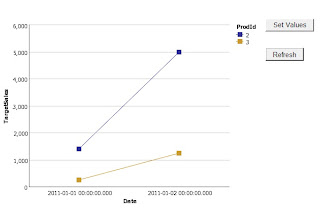
Step 5: Create the main report to display the chart object. Insert an HTML item to open the Prompted report:

HTML Item:
<script>
function SetValues()
{
window.open('<Prompted Report URL>','','width=400,height=400,menubar=no,toolbar=no');

}
</script>

<input type="button" value="Set Values" onclick="SetValues();">


Insert a RePrompt Button to refresh the report.


Dynamic Rows Per Page - Approach 2

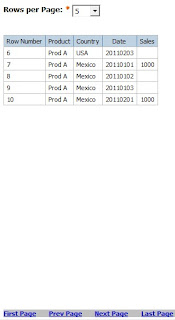
In continuation with the last article where we discussed achieving dynamic rows per page using Database functions, in this article we will discuss the same using JavaScripting where the processing happens on the client side. As discussed in the previous article report developers should weigh their options before opting for either of these approaches.

Approach 2: Client Side Processing

Solution:

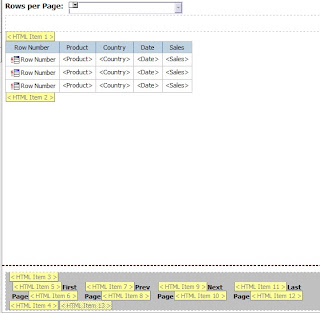
Step 1: Create a Rows Per Page value prompt with static choices of 5,10, 15.. and a default selection of 5. Set the name of the prompt to Rows.

Step 2: Create a simple list report and set the Rows Per Page property to a value higher than the total number of rows returned

Step 3: Insert HTML items before and after the list report

    HTML Item 1: <div id="ListTbl">

    HTML Item 2: </div>

Step 4: Now to create a Pagination component, create a table in the Page Footer with 4 columns. Insert HTML Items before and after the table.

    HTML Item 3: <div id="Paginate">

    HTML Item 4: </div>

Step 5: Create First Page, Prev Page, Next Page, Last Page components in the 4 columns as shown below:


    HTML Item 5: <a href="#" onClick="paginate( 1);">

    HTML Item 7: <a href="#" onClick="paginate(currentPage - 1);">

    HTML Item 9: <a href="#" onClick="paginate(currentPage + 1);">

    HTML Item 11: <a href="#" onClick="paginate(lastPage);">

    HTML Item 6, HTML Item 8, HTML Item 10, HTML Item 12: </a>

Step 6: Insert an HTML Item and include the below JavaScript code:

<script>
    //get the List Table object
    var ListTbl = document.getElementById("ListTbl");

    var Tbl = ListTbl.getElementsByTagName('table')[0];

    //get the rows per page prompt value selected

    var fW = getFormWarpRequest();

    var rowsPerPg = fW._oLstChoicesRows.value;

    //get the total number of rows in the list

    var rows = Tbl.rows.length;

    var currentPage = 1;

    //get the last page value

    var lastPage = Math.ceil(rows/rowsPerPg);

    var rowStart;

    var rowStop;

    function paginate(currentPage)
    {
        window.currentPage = currentPage;
        rowStart = (currentPage * rowsPerPg) - rowsPerPg + 1;
        rowStop = (currentPage * rowsPerPg) + 1;
        if(currentPage==lastPage)
        rowStop = rows;

        for(i=1; i < rows ;i++)
        {
            //hide the display of all rows
            Tbl.rows(i).style.display='none';
        }

        for(i = rowStart ; i< rowStop ; i++)
        {
            //set only the required rows to display
            Tbl.rows(i).style.display='block';
        }

        var Paginate = document.getElementById("Paginate");
        var PaginateTbl = Paginate.getElementsByTagName('table')[0];

        if(currentPage==1)
        {
            //hide First Page and Prev Page components when on Page 1
            PaginateTbl.rows(0).cells(0).style.display = 'none';
            PaginateTbl.rows(0).cells(1).style.display='none';
        }
        else
        {
            PaginateTbl.rows(0).cells(0).style.display='block';
            PaginateTbl.rows(0).cells(1).style.display='block';
        }

        if(currentPage==lastPage)
        {
            //hide Last Page and Next Page components when on Last Page
            PaginateTbl.rows(0).cells(2).style.display='none';
            PaginateTbl.rows(0).cells(3).style.display='none';
        }
        else
        {
            PaginateTbl.rows(0).cells(2).style.display='block';
            PaginateTbl.rows(0).cells(3).style.display='block';
        }

    }

paginate(currentPage);

</script>


Note: This technique uses JavaScript against underlying report objects in an IBM Cognos 8 BI report. For this reason, there is no guarantee that reports created using this technique will migrate or upgrade successfully to future versions without requiring modifications. Any such modifications are the responsibility of the report designer.

Dynamic Rows Per Page - Approach 1

I have been working for the last couple of weeks on developing reports that can be integrated into websites and portals. Reports that need to be integrated into such sites need to be able to support a lot of interactive requirements. And one such requirement is the dynamic rows per page concept.

There are 2 ways to implement the same, one where the entire processing is pushed to the DB side and the other where the processing happens on the client side using JavaScript.

Such interactive requirements should only be supported when the number of rows retrieved is less else report rendering is going to be slow and in cases if the client side approach is used and the client environment is not powerful enough reports could result in hung screens. Some databases do not support running functions and when used these are executed on the Cognos server impacting performance. And with each click on the report re-executes the report query causing more queries to be fired against the DB.

Hence report developers should weigh their options before opting for either of these approaches.

Approach 1: DB only

Solution:

Step 1: Create a Rows Per Page value prompt with static choices of 5,10, 15.. and a default selection of 5. Set the name of the prompt to Rows.

Step 2: Create a Page text box prompt with default value of 1 indicating that the report should display Page 1 when run for the first time. Set the Visible property of the parameter to No.

Step 3: Create a Query say Query 1 with the required data items.

Step 4: Create the following Data Items:
RunningCount: running-count(1)

Page: ceil([RunningCount]/?RowsPerPage?)

Next Page: ?Page? + 1

Prev Page: ?Page? - 1

First Page: 1

Last Page: maximum([Page] for report)
Step 5: Create Query 2 with Query 1 as the referenced query. Drag all items from Query 1. Include a filter [Page] = ?Page?

Step 6: Create a simple list report based on Query 2

Step 7: Create the Paginate components of First Page, Prev Page, Next Page and Last Page text items in the Page Footer with drill through properties set on them.

Choose the "Pass Parameter Value" for the RowsPerPage drill through parameter and for the Page parameter set the below options for the various items.
First Page: Pass Data Item / [First Page]

Prev Page: Pass Data Item / [Prev Page]

Next Page: Pass Data Item / [Next Page]

Last Page: Pass Data Item / [Last Page]
Step 8: Create conditional styles to hide the First Page, Prev Page components when on Page 1.
Conditional Style 1: ParamValue('Page') = '1'
Step 9: Create conditional styles to hide the Next Page, Last Page components when on Last Page.
Conditional Style 2: string2double(ParamValue('Page')) = [Query2].[Last Page]


Wednesday, August 17, 2011

Optional Prompt Macros

A common misconception that I have noticed people have with respect to optional prompt macros is with regards to Preceding / Trailing text in a prompt macro.

An optional prompt macro always has a default value specified, so if no prompt value is selected the default value is applied in the query but this will not cause the preceding / trailing text in the macro to get applied. The preceding / trailing text get applied only if a prompt value is selected.

A simple example to demonstrate this:

We have ProdID and Sales displayed in a report.


The report has an optional prompt macro for ProdId defined as:

[Presentation Layer].[REVENUE_FACT].[PRODUCTID]= #prompt('Prod Id', 'Integer' ,1, '', '', 'and [Presentation Layer].[REVENUE_FACT].[SALES] > 5000' )#

Notice that the prompt macro has a default ProdID value of 1 and a trailing text that will add an additional filter of Sales > 5000.

When no value is selected for the ProdId prompt, the output displays data for Prod Id 1. Notice that the additional Sales filter doesn't get applied.


And here is the output when a ProdId selection of 1 is made. The additional Sales filter gets applied and displays the sum total of Sales for ProdId where Sales > 5000.


Wednesday, July 27, 2011

Importing Objects from FM into Other FM Models - Drawbacks

There are so many issues when trying to use this feature provided by Cognos. For a simple activity I tried importing 2 Data Source Query Subjects from Physical Layer of Model A into Test Layer of Model B. But the objects got imported into Physical Layer of Model A. To add on to my woes, it also imported a whole lot of other objects that had no dependency on the imported Query Subjects. These objects were Functions. So don't know if this has to do only with functions.

Another issue I found with this approach is that relationships between imported objects also get imported. And unlike Data Source based imports where users are prompted to choose to either create relationships or not, in case of model based imports this option is not provided requiring me to manually look up the imported objects and clean out those not required.

Copies of source model packages were also created which may be because the imported objects are part of the source model packages.

This is a powerful feature when you want to save time by re-using objects designed in other models but with all the issues listed out above, it seems to be a painful feature to use for the time being, until Cognos fixes these bugs. What can make this feature easier to use apart from fixing of the bugs would be options to select the kind of objects to import like 'relationships', 'calculations' etc. that may be dependent on the imported objects rather than having Cognos import all such dependent objects.

Monday, July 18, 2011

Folders/Namespaces and Loops

As we all know loops are a complete no-no in Cognos. So having said that, I didn't want to write up this article, but thought that someone out there might benefit in knowing how folders/name spaces impact loops.

I stumbled on this while trying to help a colleague on his FM model. The model was based on an ER data model and not a dimensional data model. So loops were bound to be present but luckily there were just 12 tables to deal with, still a developer's nightmare. The issue the user was facing was with unpredictable queries getting generated which was bound to occur with loops.

I am simplifying the scenario here. Lets say there are 5 tables A, B, C, D and E. A is joined to D through B and C. A is also joined to D through E.

A-B-C-D
A-E-D

As you can see there are now 2 ways to get to D from A. If a user were to pull in items from A and D, Cognos may or may not include B/c or E. Assuming Cognos takes the shortest path (think I read this somewhere, but I may be wrong), it shouldn't have included B and C, but in the user's case it was.

After digging we found that the query subject E was placed inside a sub-folder under the main folder. So when object E was moved to the main folder where all the other objects were residing the query took the path through E.

So here's my assumption on how Cognos evaluates loops. It looks for the shortest path in the same folder as most of the objects involved in the query and only when such a path doesn't exist it evaluates other paths that involve other folders and name spaces.
 

Wednesday, June 22, 2011

My First Fusion Chart

Thanks to the articles provided by PaulM I was able to create a simple FusionChart. But a disadvantage that I discovered with the integration using embedded object method as mentioned on the FusionCharts website is the non-support of rendering charts with pure JavaScript option using this method.

Since we have some users who would like to use iPad/iPhone for viewing Cognos reports in the future this would not be an optimal solution for us. I wanted to highlight some such limitations provided in the FusionCharts website so people can make informed decisions regarding such integrations.

"When embedding using OBJECT/EMBED method, only Flash charts will show up. Additionally, features such as JSON data support, managed printing in Mozilla based browsers and enhanced browser-specific error handling would not function as well, as they are dependent on the FusionCharts JavaScript class."

Also when using pure JavaScript rendering of charts not all features available with the flash charts are supported. Like the scroll bars available for flash based charts that I was really impressed with are not available in the JS version of the charts. Hoping that this would be addressed in future releases.

I am still working on the CMS and JS rendering approach due to the limitation discussed above. Hope support for JS rendering of charts using object embedding method is brought out in future releases.

Using Layout Component References

This is in continuation with my previous article about the advantages of using Layout Component References. Creating and using Layout Component References is very easy. You create a report, let us call this the source report, that has all the components like Header items, Footer items that you would be frequently using across various reports. Name all the components in the reports.


In the target report, drag and drop the Layout Component Reference object. Choose the source report and the components you wish to use.


If you wish to override some of the objects pulled in then select the object and click on the "Overrides" property and choose the named sub-component that you wish to over-ride. For example, for some reports you would like a different Logo to be displayed. You can override the report title but continue to use the styles, fonts set for that table cell.


A sample of the overridden layout component where the logo and the report title objects have been overridden:

Friday, June 10, 2011

Templates vs Layout Component References

Often I have been asked if it is a best practice to create report templates and have developers use them for basing their reports. But instead I would suggest going with layout component references and using them in reports. Layout Component References offer a lot of advantages over the traditional Template approach. The references can be used as a base and can be over-ridden for particular report requirements. And any time there is a change to the layout component the reports will all reflect the changes unless the object has been over-ridden. This saves developers a lot of time making the changes across reports.

In my next article, I will touch base on creating and using Layout Component Objects.
 

Monday, May 30, 2011

Scrollable Lists

Requirement: Display a Prompts Pane and a List Pane. The list should display all rows in a single page with the capability to scroll. Note: the Prompts pane should remain visible to the users while scrolling down.

The simplest way to achieve the above requirement would be to use CSS. The advantage of providing scroll bars as part of the list is you can have other objects on the page still in user's visibility.

Solution:

Step 1: Create a table with 2 columns. Add the required Prompts to Column 1 and the list object to Column 2. Set the height for the table cell in which you would like to place the scrollable list.

Step 2: Insert HTML items as shown below:


HTML 1: < div style="height: 100%; overflow: auto;" >

HTML 2: </div>
 

Friday, May 20, 2011

Chart Conditional Measures - Conditional Legend

When you create a chart based report that accepts multiple measures as input using case statements the legend is displayed for all the series and not just for the measures selected. To avoid this, disable the chart provided legend and create a manual legend next to the chart and use the colors set in the chart palette to display the right colors for the right series.


Wednesday, May 11, 2011

Expand / Collapse Javascript

Very recently I implemented a requirement to provide expand / collapse feature in long-spanning reports. The JavaScript for this is available on Cognos Support Site. Wish Cognos provides objects for this rather than using javascripts that can prove to be unreliable during upgrades.

What I wanted to focus on through this article is to provide an overview of what this JS does, because it is important to understand the code that you include/integrate into your reports so it is easier to debug issues.

The code is fairly self-explanatory. I have explained the code at a high level:
  • Identify the selected row (the row for which an expand/collapse has been initiated).
  • Switch the icon for the selected row from an expand to collapse or vice-versa.
  • Process all rows below the selected row.
  • For each row processed, called as current row, identify if the initiated function was an expand/collapse.
  • If collapse, then set style property for current row to "none" which will hide current row. If the current row contains an image and if the image is a collapse icon, then re-set the icon to expand icon and hide the row by setting the style property to "none". All rows below the row clicked get hidden and any collapse icons are re-set so when the higher level is expanded, the clickable rows below display an expand icon and not a collapse icon.
  • If expand, and if the current row is at level lower than immediate lower level, then set style property for current row to "none" to hide the row. If the current row is at an immediate lower level then set style to "" to display this row. If the current row contains an image, and if the current row is a sibling level for the selected level then do not process the row.
  • The StartHidden function is called on load of the page. This function gets the table element and hides all rows where padding has been set by setting the style property to "none". Thus all rows except the 1st level rows get hidden on load of the report.

[User comments: RecoveringAdmin]
I implemented this as well when I saw that article in the KB. Well, more specifically, when my users saw that article. The downsides I found with this solution are that it's HTML ONLY. if you want to export a specific state to xls or pdf (say, a few rows expanded, some contracted) you would have to screen scrape and repass those selections to cognos as part of some parameter set. Just rerunning the report to another format will disregard the javascript. (pdf and xls engine rebuilds the result set and disregards the html blocks). It's a neat trick, but not super useful as a report output.

<script>
// These settings you can change to modify the report processing
var UOM="px"; // Set to unit of measure for padding
var INDENT_SIZE=20; // Set to indent padding step size. Setting to 20 means the padding steps are 20,40,60,80. These have to match the padding applied to the report objects
var UOM_SIZE = UOM.length;
function stripTrailing(string,num) {
if ( string == "") {return parseInt(0);} else {return parseInt(string.substring(0,string.length-num));}
}
function ExpandCollapse( el )
{
// Grab the ROW that was clicked and the TABLE that contains it
var tr = el.parentElement.parentElement;
var tbl = tr.parentElement.parentElement;
// Set the alternating display values for hiding/showing the row
var sDisplay = ( el.src.indexOf( "minus" ) == -1 ) ? "" : "none";
var sDisplayReverse = ( el.src.indexOf( "minus" ) == -1 ) ? "none" : "";
//Switch the icon for the clicked row
el.src = "../pat/images/PropertyGroup_" + ( el.src.indexOf( "minus" ) == -1 ? "minus" : "plus" ) + ".gif";
// Starting with the row below the clicked row, start checking each row
for ( var i = tr.rowIndex + 1; i < tbl.rows.length; i++ )
{
// Set the Current row indicator nad the left padding value
var trCurrent = tbl.rows( i );
var trCurrentLeft = trCurrent.cells(0).style.paddingLeft;
// if the current row contains an IMG in it, it's a clickable level and we either have to stop processing,
// or reset the icons to a + as it's being collapsed
if ( trCurrent.cells( 0 ).firstChild && trCurrent.cells( 0 ).getElementsByTagName( "IMG" ).length )
{
// If the current row is at the same level or above in the tree, then stop processing,
// else reset all the signs below it, essentially collapsing all branches underneath the one that is beig collapsed.

if ( stripTrailing(trCurrentLeft , UOM_SIZE) <= stripTrailing(tr.cells(0).style.paddingLeft , UOM_SIZE) )
{ break; }
else
{
if (el.src.indexOf( "minus" ) == -1 )
{
trCurrent.cells(0).getElementsByTagName("IMG").item(0).src = "../pat/images/PropertyGroup_plus.gif";
}
}
}
// Now, we determine if the row should be hidden or shown.
if ( eval(stripTrailing(tr.cells(0).style.paddingLeft, UOM_SIZE) + INDENT_SIZE) < stripTrailing(trCurrentLeft, UOM_SIZE) && el.src.indexOf( "minus" ) > 0 )
{
trCurrent.style.display = sDisplayReverse;
} else
{
trCurrent.style.display = sDisplay;
}
}
}
function StartHidden(el)
{
var tbl=el.parentElement.parentElement.parentElement.parentElement;
for (var i = 0; i < tbl.rows.length; i++)
{
var trCurrent = tbl.rows(i);
if (trCurrent.cells(0).style.paddingLeft.indexOf(UOM) > -1)
{
trCurrent.style.display = "none";
}
}
}
</script>

Note: This technique uses JavaScript against underlying report objects in a IBM Cognos 8 BI report. For this reason, there is no guarantee that reports created using this technique will migrate or upgrade successfully to future versions without requiring modifications. Any such modifications are the responsibility of the report designer.
 

Thursday, April 28, 2011

FusionCharts Rocks!!!

Been working on a PoC integrating FusionCharts with Cognos and I have to say, FusionCharts really look amazing. With these charts so many of the limitations that we come across using Cognos charts can be overcome. There are some awesome charts/widgets out there like funnel charts that are still not available with Cognos 10.

With FusionCharts, you can even have charts that scroll thus not compromising on the amount of data displayed along the x axis nor the look and feel. There are so may properties that can be set for the chart too. And I think with this you can set a lot of values dynamically like dynamic trend line values. Really cool. But I think the drill through functionality might be a little lacking when we try using this through Cognos. FusionCharts does have a linked report concept that I am hoping is similar to drill through functionality but need to check it out.

PaulM's contribution:
The drill through (clickURL) functionality works perfectly. You can even perform a self drill through to mimic a drilldown.

The trick is to use repeaters not repeater tables or lists with HTML items. Lists and repeater tables insert useless table and cell tags. Text items are wrapped in spans.

There are two ways of embedding the data directly into the graph.

1. You can use the setDataXML() function.

2. You can also use the HTML embedding method detailed here: http://www.fusioncharts.com/docs/FirstChart/HtmlEmbed.html
 

Wednesday, April 20, 2011

Date Difference function in Teradata

To get the difference between dates in Teradata you do not have to use any date diff functions. Its a simple A - B calculation where A and B are date columns. This works in a SQL query. But when you try the same through Cognos, the difference calculation gets pushed to the Cognos server side rather than being handled at the DB side. To work-around this, use the _days_between Cognos function and then notice that the Native SQL now includes an A - B calculation.
 

Friday, April 15, 2011

Deleting Report Output Versions

The easiest way to deleting report output versions across reports would be to re-export and re-import the reports and unchecking the Include Report versions property while creating the export. This then deletes all report output versions that have so far been created in your production environment for the reports imported. But this works only for Public Folders reports. To delete report output versions created in users My Folders or to delete all report output versions except the last x versions you would need to use SDK.
 

Wednesday, March 30, 2011

Creating Drill-Through Style Reports using Parametrized URLs

Here's an example of how you can create Drill Through Style Reports using Parametrized URLs against saved report outputs.

Requirement: Create a parent report displaying various Product Lines. Create a child report that displays individual Product Line details. Both the reports need to be scheduled and saved. Users should be able to navigate from each parent Product Line record in the parent report to the corresponding product line child report output.

The requirement to have the reports scheduled and saved makes sense when you are dealing with either huge amount of data being pulled into these reports or being rendered in the reports causing them to run for a long time when run on-demand. Hence it makes perfect sense to have these reports scheduled to be run once a day, burst and saved.

Solution:

Step 1: Create the parent report by dragging in the Prod Line data item.

Step 2: Create the child report by dragging in Prod Line and the other required data items. Set the bursting options on this report to produce burst outputs by Prod Line.

Step 3: Now to create the navigational links, look up the search path for the child report.

Step 4: In the Parent report, create the HTML items as shown below:


HTML Item 1: <a href="../cgi-bin/cognos.cgi?b_action=cognosViewer&ui.action=view&ui.object=/content/folder[@name='Reports']/report[@name='Dim - Parm URL 2']/reportVersion[last()]/output[contains(@burstKey,'

HTML Item 2: Set the source type to Data Item Value and choose the Prod Line data item.


HTML Item 3: ')]&cv.header=false&cv.toolbar=false">

Use the cv.header and cv.toolbar if you need to hide the Cognos Viewer header and toolbar.

HTML Item 4: </a>

Step 5: In the child report, create the link to the parent report as shown below:


HTML Item 1: <a href="../cgi-bin/cognos.cgi?b_action=cognosViewer&ui.action=view&ui.object=/content/folder[@name='Reports']/report[@name='Dim - Parm URL 1']/reportVersion[last()]/output&cv.header=false&cv.toolbar=false">

HTML Item 2:</a>

Step 6: Run and save the output for the parent report. Run and burst the outputs for the child report.


Clicking on Camping Equipment in the above saved output displays the below saved Camping Equipment output in the same window.


And clicking on the Camping Equipment link in the child output takes you back to the parent report displayed in the same window.

You may notice that as you navigate back and forth between the 2 reports, the left side margin space increases pushing your report to the left and scroll bars appear in your reports now. To avoid this use a target="_parent" tag in your HTML items. If folks are interested then I will blog about why this seems to be happening.

Related Articles:
 

Monday, March 21, 2011

Avoid Paginating Saved HTML Outputs

When you burst/save HTML outputs, you must have noticed that Cognos by default paginates the outputs with the default value being 20 rows per page. In saved outputs, this causes sections of the report to repeat down the length of the single HTML page. This can be avoided by setting the rows per page property for report objects.

However, you can also set "Paginate saved HTML output" available under File Menu > Report Properties to achieve the same. This property saves users from having to set a very high value for the Rows Per Page property against each report object.

Friday, March 11, 2011

Parameterized URLs for Retrieving Burst Outputs - Part 2

I had long written about using Parametrized URLs for retrieving burst outputs (Parameterized URLs for Retrieving Burst Outputs). The solution proposed works when your burst Ids are unique across all report versions as was in my case. But what if the report generates the same set of burst outputs each time but with different data and you have report versioning property set to more than 1?

In this case, you need to modify the URL as shown below:

http://< server>?b_action=cognosViewer&ui.action=view&ui.object=/content/folder[@name='TEST']/reportView[@name='TEST REPORT']/reportVersion[last()]/output[contains(@burstKey,'123')]

The "last()" keyword over here ensures that Cognos looks through the latest report version to get the burst output with burst key 123.

Related Articles:
 

Friday, February 25, 2011

Remap to New Source in FM

Very recently found this option really handy in FM. This option is real useful when you have a model already built and at a later date there are changes to the tables being used with the possibility of an existing table getting dropped and the information being made available in another table or in a new table.

Dropping a data source query subject would invalidate your business layer and in earlier versions of Cognos this would result in re-designing and re-developing certain sections of the model. This has now been made easy with the "Remap to new source" option available on model query subjects. With this option you can remap individual columns in a model query subject to other columns in your physical layer.

You can also remap multiple columns at one go by setting options to match columns from the source to target and then drag all columns from the data source query subject to the model query subject and Cognos will automatically remap the various columns based on the options set. This is useful when your query subjects contain a huge number of columns.


Monday, February 14, 2011

Cognos 10 - Scheduling Features

Came across an IBM Supportlink article mentioning a new scheduling feature available with Cognos 10 that I think is really helpful.

There are many times when you wish to schedule your report to run once every x hours but on certain days in the week and only between certain time range on those days. This was so far not possible up until Cognos 10. Cognos objects could only be scheduled to run once every x hours or only once on certain days of the week, a combination of hours on week days was not possible.

With Cognos 10, users can now schedule their reports to run once every x hours on certain days of the week between certain time range on those days. You can read up more on this on IBM support link article.
 

Friday, January 28, 2011

XPath: An Introduction

XPath is a query language used to navigate through an XML structure. In other words, assume you have the following folders on your C drive: Folder 1, Folder 2 that is inside Folder 1, Folder 3 that is stored inside Folder 2. Now to access Folder 3, you would probably type C:\Folder 1\Folder 2\Folder 3 in your run command. Likewise, XPath can be considered as a language that would help you navigate your XML document and locate specific XML sections in your document.

Let us consider a simple XML structure as below:

<Products>
  <ProductLine name="Product Line A">
      <Product type="Product Type A">A</Product>
      <Product type="Product Type A">B</Product>
      <Product type="Product Type A">C</Product>
  </ProductLine>
  <ProductLine name="Product Line B">
     <Product type="Product Type B">D</Product>
     <Product type="Product Type B">E</Product>
     <Product type="Product Type B">F</Product>
 </ProductLine>
 <ProductLine name="Product Line C">
    <Product type="Product Type C">G</Product>
 </ProductLine>
</Products>

Using XPath you can traverse the structure using the following XPath Expressions:

node - Select all the nodes with the name "node" Example: Products would return all nodes with node name Product.
/ - Select the root node. In our example XML this would return the root Products node.
// - Select all the nodes in the document from the current node that match the defined condition. //ProductLine would return all ProductLine nodes assuming we are at the root node.
@ - Select attributes. ProductLine[@name = 'Product Line A'] would return Product Line nodes with name value set to Product Line A.

XPath Predicates: XPath Predicates allow you to select nodes containing defined values.

node[1] - Select the first node of type node. ProductLine[1] would return the first Product Line node.
node[@type='Type 1'] - Select nodes that have type attribute with value Type 1.
node[@value > 100] - Select nodes that have value attribute with value > 100.

There are many more such expressions and predicates that you can use. But not all are supported by CMS. Only a subset of the XPath expressions and predicates are supported by CMS.

In my next article I will write about how to get the XML of the data generated by Cognos.Note, this XML is not the same as the report XML. The report XML defines the report specification while the XML we are dealing with in CMS defines the report output or rather the report data along with the styles that go with the data.

CMS XPath Examples:

Consider a report that has 2 pages (Yearly Revenue Page, Revenue Detail Page). The Yearly Revenue Page displays a revenue chart and the Revenue Detail Page displays 2 lists - Sales Region Revenue and Product Revenue.


To get all the nodes of type list.

http://localhost:81/cognos84/cgi-bin/cognos.cgi/rds/reportData/report/i754384CF51C94873A34DABCF36108B16?xpath=//lst


To get all the column titles of the list nodes.

http://localhost:81/cognos84/cgi-bin/cognos.cgi/rds/reportData/report/i754384CF51C94873A34DABCF36108B16?xpath=//lst/colTitle/item/txt


To access the Region Sales list on Page 2.

http://localhost:81/cognos84/cgi-bin/cognos.cgi/rds/reportData/report/i754384CF51C94873A34DABCF36108B16?xpath=/document/page[2]/body/item[1]


To select Row 1 of Group 1 (2004) of Region Sales list.

http://localhost:81/cognos84/cgi-bin/cognos.cgi/rds/reportData/report/i754384CF51C94873A34DABCF36108B16?xpath=/document/page[2]/body/item[1]/lst/group/grp[1]/row[1]


To get all Asia Pacific rows of Region Sales list.

http://localhost:81/cognos84/cgi-bin/cognos.cgi/rds/reportData/report/i754384CF51C94873A34DABCF36108B16?xpath=/document/page[2]/body/item[1]/lst/group/grp/row[cell/item/txt/val='Asia Pacific']


To get row 2 in each group of Region Sales list.

http://localhost:81/cognos84/cgi-bin/cognos.cgi/rds/reportData/report/i754384CF51C94873A34DABCF36108B16?xpath=/document/page[2]/body/item[1]/lst/group/grp/row[pos()=2]